


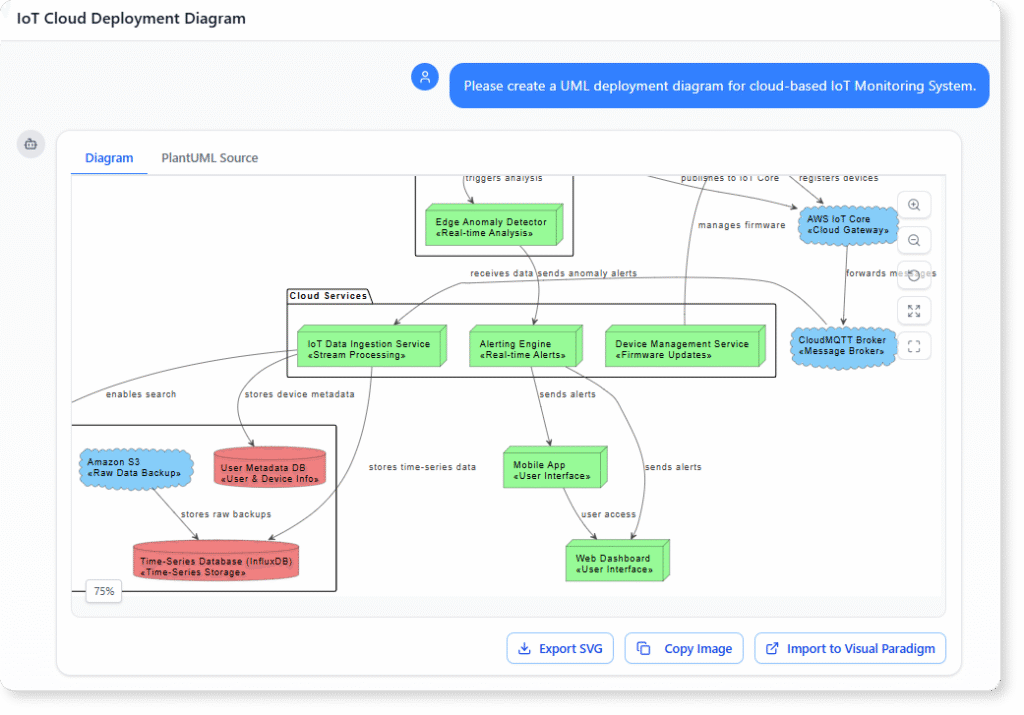
Understanding how your system is deployed across servers, clouds, devices, or containers is essential for planning, communication, and long-term maintenance. A UML Deployment Diagram helps visualize this structure, but creating one manually often takes time, especially when your architecture involves multiple nodes, execution environments, or distributed services.
This is where an AI Deployment Diagram Generator becomes valuable. Instead of dragging shapes, naming devices, or aligning connections, you can simply describe your infrastructure and receive a complete deployment diagram in seconds.
Why Deployment Diagrams Matter in System Architecture
A UML Deployment Diagram describes the physical structure of your system, including:
-
Servers, devices, cloud services, nodes
-
Execution environments such as containers or virtual machines
-
Artifacts deployed onto each node
-
Communication paths between components and environments
With these elements visualized, you are able to understand how your system is actually running, not just how it logically behaves. This real-world perspective makes it easier to plan capacity, identify inefficiencies, and communicate with both technical and non-technical stakeholders.
Creating Deployment Diagrams with AI Instead of Manual Modeling
Traditional modeling requires repetitive tasks. You need to:
-
Create nodes
-
Specify artifacts
-
Place execution environments
-
Draw communication paths
-
Label everything clearly
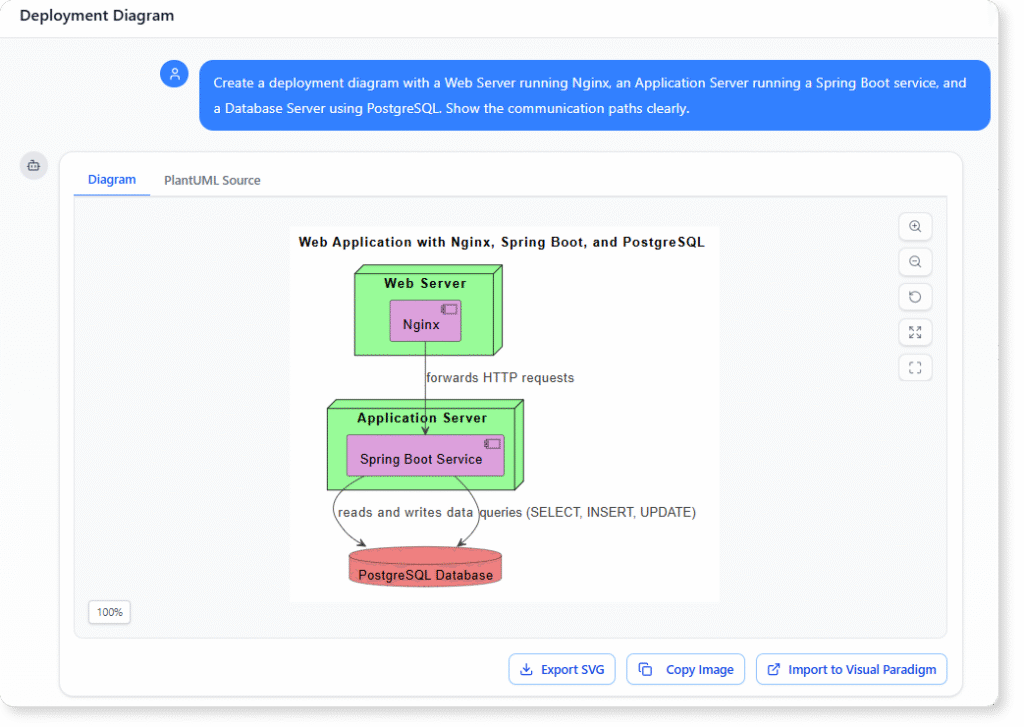
The AI Deployment Diagram Generator eliminates these steps. You can describe your system in natural language, such as:
Create a deployment diagram with a Web Server running Nginx, an Application Server running a Spring Boot service, and a Database Server using PostgreSQL. Show the communication paths clearly.
The AI instantly converts your text into a visual deployment diagram. It becomes a faster, cleaner, and more accessible way to capture system infrastructure without relying on manual modeling skills.
Refining and Expanding Your Diagram Through Chat
After generating the first version of your diagram, you can refine it simply by talking to the AI tool. You can add more details, split nodes, convert VMs into containers, or reorganize the structure by giving direct instructions.
Examples of refinements include:
Add a Redis Cache node connected to the Application Server.
Change the Database Server to a managed PostgreSQL service in the cloud.
Group all microservices under a container cluster node.
The AI updates your diagram without requiring you to redraw anything.
This conversational workflow saves time and makes architecture exploration far more flexible.
Using AI Suggestions to Review Your Infrastructure
Beyond creating diagrams, the AI can point out architectural patterns, potential bottlenecks, or opportunities to improve your system. For example, you can ask:
What should I improve based on this deployment?
Is there any recommended architecture pattern for this setup?
How can I scale this design?
The AI analyzes the structure and provides insights that would usually require additional research. These suggestions help you understand best practices and explore different deployment options.
Why You Need Documentation, Not Just Diagrams
Diagrams are essential, but documentation adds the context needed for ongoing development. When paired with an AI generator, you can ask for clear explanations of:
-
What each node represents
-
What artifacts are deployed where
-
Why certain connections exist
-
How the overall topology supports performance, availability, or redundancy
Clear documentation improves onboarding, supports audits, and creates a long-term reference for architecture planning.
With AI, both diagrams and documentation become easy to generate and keep up to date.
Benefits of Using an AI Deployment Diagram Generator
-
No need for manual modeling
-
Faster communication across teams
-
Easy updates and refinements through chat
-
Immediate access to architectural insights
-
Accurate documentation generated on demand
-
Helps you align infrastructure with best practices
-
Reduces diagramming time, especially for complex systems
AI essentially removes the friction from visualizing and maintaining your deployment architecture.
Conclusion
Visualizing your system infrastructure does not need to be time-consuming. With an AI Deployment Diagram Generator, you can describe your architecture and instantly receive a professional deployment diagram, refine it through conversation, and generate detailed documentation when needed. This efficient workflow helps you understand your system more clearly, plan improvements, and keep your design up to date with minimal effort.