


When operational bottlenecks, quality defects, or system failures occur, troubleshooting symptoms without finding the underlying cause leads to repeated issues. An Ishikawa Diagram—commonly known as a Fishbone Diagram or Cause-and-Effect Diagram—serves as a visual tool for root cause analysis. It categorizes potential causes of a problem to systematically uncover why an issue occurred.
While manually mapping complex cause-and-effect branches used to mean hours of drawing and brainstorming on whiteboards, using an AI chatbot makes fishbone diagramming fast, structured, and easy to analyze.
This guide covers the core essentials of Ishikawa Diagrams and demonstrates how to streamline your root cause analysis using plain English prompts.
What is an Ishikawa Diagram?
An Ishikawa Diagram visualizes the relationship between a central problem (the “head” of the fish) and its contributing factors (the “bones”). By grouping potential causes into structured categories, it helps teams analyze issues systematically rather than jumping to premature conclusions.
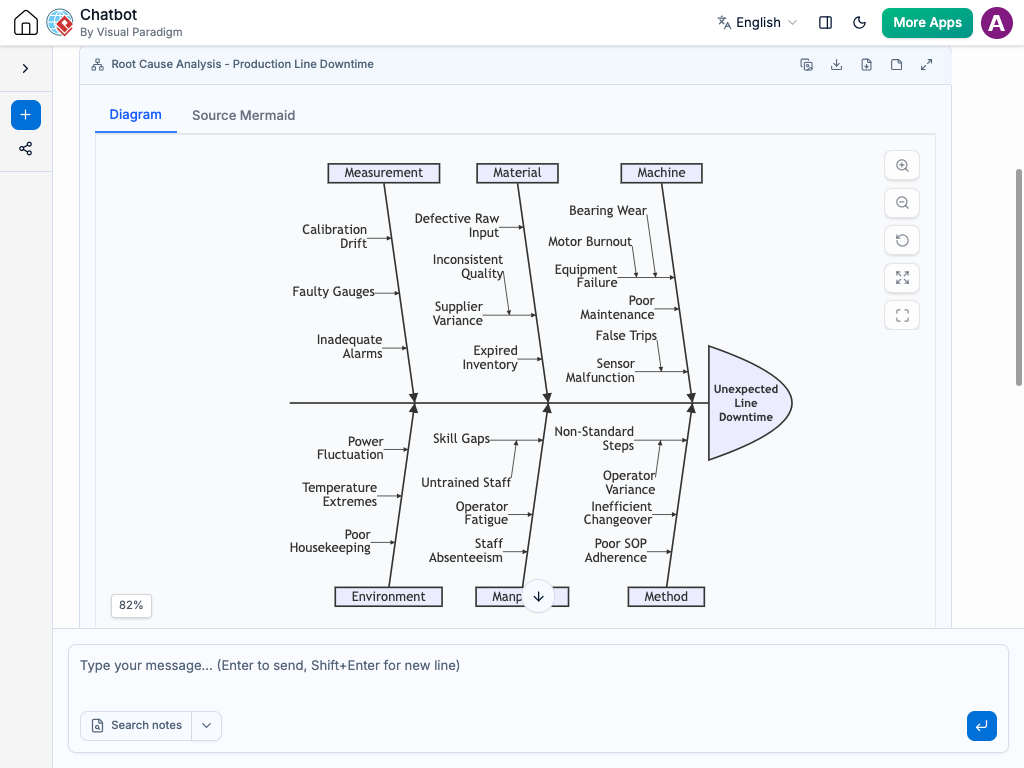
Core Ishikawa Diagram Components
-
Effect / Problem Head: The specific problem statement or quality defect being investigated, placed in a box at the far right.
-
Central Spine: A horizontal line leading directly to the problem head, serving as the main anchor for all cause categories.
-
Primary Cause Categories (Major Bones): Large diagonal lines branching off the spine. In manufacturing and service contexts, these often follow standard frameworks:
-
6 Ms (Manufacturing): Manpower, Machine, Material, Method, Measurement, Milieu (Environment).
-
8 Ps (Services/Product): Price, Promotion, Place, Product, People, Process, Physical Evidence, Productivity.
-
-
Secondary & Sub-Causes (Minor Bones): Smaller horizontal and diagonal lines branching off the major bones, representing specific root factors uncovered through techniques like the “5 Whys.”
Why Use AI for Root Cause Analysis?
Brainstorming causes manually can lead to cognitive bias, where teams focus only on familiar areas and overlook systemic factors. An AI chatbot transforms how teams investigate operational and technical issues:
-
Instant Category Framing: Describe an issue in plain language, and let the AI chatbot instantly construct a structured fishbone framework using relevant industry categories.
-
Unbiased Root Cause Discovery: Ask the AI chatbot to suggest overlooked secondary and tertiary causes based on historical data and industry patterns.
-
Rapid Branch Refactoring: Update cause branches easily by prompting the AI chatbot with instructions like “Move ‘Outdated Firmware’ from Method to Machine and add sub-causes for legacy hardware dependencies.”
-
Automated Corrective Action Reports: Convert visual fishbone structures directly into structured remediation plans, risk registers, or audit handover documents.
Common Use Cases for Ishikawa Diagrams
Fishbone modeling provides structured analytical clarity across diverse operational fields:
-
Software Quality Assurance & Incident Post-Mortems: Analyze production outages, bug clusters, or performance bottlenecks by mapping infrastructure, code, and process factors.
-
Manufacturing & Operations Quality Control: Identify defect drivers in assembly lines, supply chain delays, or equipment failures.
-
Healthcare & Patient Safety Audits: Investigate clinical errors or workflow delays to strengthen protocol compliance.
-
Customer Support & Service Optimization: Pinpoint the root drivers behind rising ticket volume or declining customer satisfaction scores.
Practical AI Prompts for Ishikawa Diagrams
Clear prompt input leads to precise cause-and-effect models. Here are practical prompt examples you can copy and use:
-
Basic Problem Breakdown: “Create an Ishikawa diagram for a high e-commerce cart abandonment rate using the 8 Ps framework.”
-
Applying the 6 Ms: “Build a fishbone diagram analyzing a software release delay using Manpower, Machine, Material, Method, Measurement, and Environment.”
-
Deepening Root Causes (5 Whys): “Expand the ‘Database Timeout’ branch in this fishbone model by adding three levels of sub-causes using the 5 Whys technique.”
-
Actionable Remediation: “Analyze this completed fishbone diagram and generate a prioritized list of corrective actions based on the primary root causes.”
A Modern Workflow for Operations and Technical Teams
Integrating an AI chatbot into your problem-solving routine accelerates incident resolution:
-
Live Incident Post-Mortems: Construct cause-and-effect maps live during post-incident reviews by feeding retrospective discussion notes directly into the AI chatbot.
-
Living Risk Blueprints: Keep operational risk models up to date continuously by having your AI chatbot update cause categories whenever processes change.
-
Cross-Functional Alignment: Structured visual cause maps eliminate finger-pointing between operations, engineering, and management teams.