


In modern software development, managing code repositories and collaboration relies heavily on clear version control strategies. A Git Graph diagram serves as the visual map of a repository’s history, depicting branches, commits, merges, and tags over time. It provides developers, DevOps engineers, and technical leads with immediate clarity on how feature branches isolate work and how code merges back into production.
While manually drawing commit graphs or trying to parse dense terminal logs can be tedious, using an AI chatbot turns branch visualization into an instant, conversational task.
This guide covers everything you need to know about Git Graph diagrams and demonstrates how an AI chatbot simplifies repository workflow documentation.
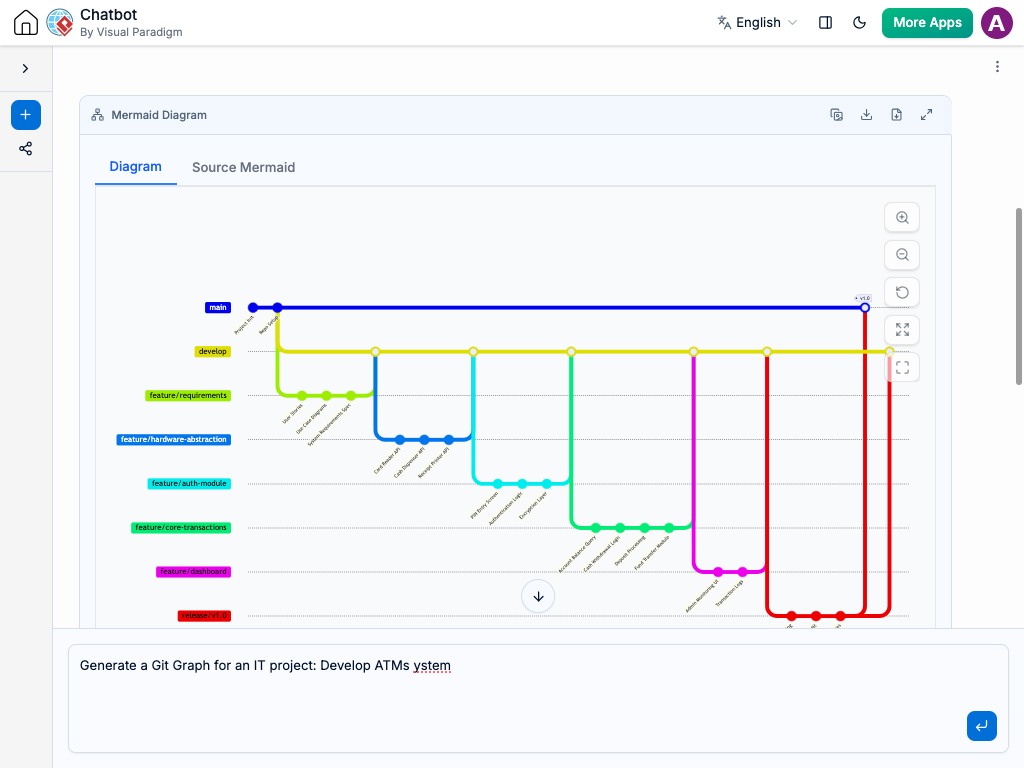
What is a Git Graph Diagram?
A Git Graph visualizes the timeline and structure of a Git repository. Rather than focusing on individual file changes, it highlights the structural evolution of the codebase—showing where feature work split off, where parallel development took place, and where releases were tagged.
Core Git Graph Components
-
Commits: Represented as nodes (circles or points) along a line. Each node signifies a specific snapshot in the project’s timeline.
-
Branches: Represented as colored vertical or diagonal lines running parallel to each other (e.g.,
main,develop,feature/login). They show independent lines of development. -
Merges: Indicated by connecting lines where a feature or hotfix branch joins back into a primary branch (such as
mainorrelease). -
Tags & References: Visual indicators or badges pointing to specific commits, highlighting key milestones like version releases (e.g.,
v1.0.0).
Why Use an AI Chatbot for Git Graph Visualization?
Reading command-line branch trees or manually creating visual guides for complex release workflows can lead to confusion. An AI chatbot streamlines this process:
-
Instant Branch Mapping: Describe a branching strategy (such as Git Flow or GitHub Flow) in simple terms, and let the AI chatbot generate a visual graph in seconds.
-
Troubleshooting Merge Conflicts: Describe complex branch states to your AI chatbot to visualize potential merge paths and avoid accidental code overwrites.
-
Frictionless Workflow Updates: Updating a Git strategy diagram is as simple as sending a prompt, like “Show a hotfix branch splitting directly off the main production tag.”
-
Clear Onboarding Guides: Generate visual representations of team branching conventions to help new developers understand project release cycles faster.
Common Use Cases for Git Graph Diagrams
Visual repository tracking delivers immediate benefits across software teams:
-
Branching Strategy Planning: Communicate team conventions—like Git Flow, Trunk-Based Development, or feature branching—with clear visual references.
-
Release Management: Document exact release timelines, showing which feature branches were included in specific deployment milestones.
-
Code Review & Audit Handovers: Provide visual context in pull requests or release notes to show how dependent changes fit together before merging.
-
Developer Onboarding: Offer clear visual guides for junior engineers to learn how to branch, commit, and open merge requests according to project rules.
How to Generate Git Graphs with an AI Chatbot: Practical Prompts
Clear instructions yield accurate repository graphs. Here are practical prompt examples you can copy and use:
-
Basic Feature Branching: “Create a Git graph showing a
mainbranch with two commits, afeaturebranch splitting off, and a merge back intomain.” -
Mapping Release Cycles: “Generate a Git Flow graph with
main,develop, and arelease/1.0branch.” -
Visualizing Hotfixes: “Show a production issue fix where a
hotfixbranch branches off tagv1.2onmainand merges back into bothmainanddevelop.” -
Trunk-Based Development: “Create a minimal trunk-based Git graph showing short-lived feature branches merging directly into
mainafter every commit.” -
Adding Tag Milestones: “Add a version tag
v2.0.0to the latest commit on themainbranch.”
A Modern Workflow for Development Teams
Incorporate an AI chatbot into your engineering documentation process:
-
Pull Request Context: Embed quick Git graph diagrams in pull request descriptions to give reviewers immediate visual context on complex branch merges.
-
Living Release Docs: Keep release notes updated effortlessly by using your AI chatbot to update diagrams as new release branches are cut.
-
Team Alignment: Ensure remote and distributed teams follow uniform version control practices through clear, shared visual guidelines.
Conclusion
Git Graph diagrams are essential for understanding, planning, and managing version control in modern software engineering. By combining standard repository tracking with the convenience of an AI chatbot, development teams can create, update, and share branching guides effortlessly. Instead of wrestling with command-line outputs or manual drawing tools, you can focus on writing code and shipping features smoothly.